When we first published “The Rising Storm” in late 2024, our research revealed the first gusts of a looming labor shortage coming for the US. The huge population of Baby Boomers, who created the workforce expectations that still shape the market today, is now retiring in droves. But the smaller generations that follow aren’t filling the Boomers’ shoes. They are fewer in number and have different attitudes toward work, fueling misalignments in the labor force. At the same time, immigration is slowing, the population is aging, birth rates continue to fall below replacement levels, and worker shortages are hitting several key industries already.
The central narrative of this research still holds, but over the past year, the US has seen new shifts in population, technology, and public policy—meaning that several key aspects of the research have evolved. Most notable are the changes in immigration and population growth projections. We’ll share these and other updates here, chapter by chapter.
Update to Chapter 1, “Conditions Forming”: Marriage and Birth Rates
First, a small but important update to the fundamental backdrop for our research from Chapter 1 is to marriage and birth rates.
“Rising Storm” showed data through 2020, indicating a steady decline in marriages—which is a leading indicator of future birth rates. But new data through 2024 shows that marriage rates (the share of households headed by a married couple) hit a trough of 46.8 in 2022, before a slight rebound up to 47.1 by 2024.
Birth rates hit their lowest point the following year, in 2023, but new data shows these have seen a small bounce back as well.
However, the rise in both birth and marriage rates is likely explained, at least in part, by the surge in immigration in ‘22 to early ‘24. Among the foreign-born population, both marriage rates and birth rates are typically higher than those of the US-born population.
While most of the labor-force effects of birth rates are not seen for nearly two decades, the importance of these numbers in the present is that any new declines in US labor force participation are unlikely to result from a shortage of childcare or from parents leaving the labor force to raise children.
Key Revisions to Chapter 2, “The Outer Bands”: Labor Force Participation
The heart of this chapter was the state of the Labor Force Participation Rate (LFPR) and the number of people who said they were not in the labor force. First, the LFPR has not shown signs of recovery, so the trend we were seeing last year now looks more permanent.
Similar to the rise in marriage and birth rates, one reason the LFPR also started to recover in ’22 and ’23 was the significant increase in immigrants, many of whom came to the US to work. With their recent departures (which we will discuss below), combined with the ongoing rise in Boomer retirees, LFPR has begun to fall again, from 62.7 in late 2024, when we first published the report, to 62.4 by the end of 2025. We expect this overall decline to continue in 2026.
On the flipside, the number of people who are not in the labor force has taken a dramatic upward curve and has hovered around 8 million higher than the pre-pandemic level. In fact, this increase can be explained in 3 ways:
1. The continued surge in retirements (The US will see record numbers of people turning 65 through 2026.)
2. Slack economic conditions, and
3. An increase in foreign-born workers who left the workforce to avoid potential deportation or legal issues.
Regardless of the reasons for the rise in people who are out of the labor force, the number is significant and likely irreversible.
The decline in the over-55 labor force is dramatic as the last waves of wealthy Boomer retirees depart. As we will show in the update to Chapter 3, this was this age group that the BLS had previously expected to drive future net labor force growth. Some net growth will probably continue for the next few years, but by 2030, all Baby Boomers will be aged 66–81, and unlikely to stay in the labor force at high rates.
Major adjustments to Chapter 3, “Landfall: the Decade Ahead”
The BIG Shift, Population Collapse
Chapter 3 is where we identified the biggest changes. For starters, a critical chart in “The Rising Storm” showed the US population outpacing labor force growth by eight to one. In actuality, even at the time our report was released, there was a mismatch in the timing of our data sources, and the ratio was closer to four to one.
This is still a remarkable number, given that the last time ratios were like this was decades ago, when the high number of people not in the labor force were children—who would one day grow up and become working contributors to the economy. But now, as we’ve just seen, the out-of-labor force population is at the opposite end of the age spectrum as more and more people retire.
The US is losing economic producers and gaining consumers for the foreseeable future.
Since the report’s publication, another key aspect of those forecasts has changed dramatically. Due to the recent reversal of asylee and parolee status for a number of countries, almost across the board, the Congressional Budget Office (CBO) has revised their population estimates. These new projections are even more troubling: namely, that the native-born US population is now projected to invert (shrink) starting in 2031.
This means that just five years from now, the US will begin to see more deaths than births. When we first published the report, this unprecedented inversion wasn’t expected until 2039: an astonishing eight-year shift.
This has dire and immediate implications for the US labor force. Consider this: before populations invert, their labor force inverts first—since people typically retire many years before passing. With the US-born population projected to invert in just five years, it is very likely that the US-born labor force is already in an inversion. Time, and future data revisions, will bring more certainty.
Due to the lack of a recent census and the difficulty of modeling population changes that clearly separate native-born from foreign-born people, the currently available data may falsely show that the native-born labor force is still growing.
To understand what we mean, look at the charts below. When we compare current labor force trends to the trends prior to the surge in asylees in 2022 through early 2024, the native-born labor force numbers seem off, indicating that this data may see significant revisions.
In 2007–2014, growth in both labor forces was fairly flat. Then during the late 20-teens until the pandemic, the immigrant labor force grew alongside the native-born labor force, contributing at a 41% level to the native born’s growth. The sharp plunge in labor force participation in 2020 and 2021 significantly impacted the native-born labor force, which did not recover (and likely has never recovered) until 2025.
2025 is when population updates were made to belatedly try to account for immigration surges. So this is when inaccuracies may have crept in. The BLS uses the Current Population Survey (CPS) to model the size of the labor force, but small sample sizes during non-census years and self-reported data make counts of foreign- and native-born workers especially difficult to pin down–a problem we did not fully appreciate when we published the report in late 2024. And calculating the size of the foreign-born labor force is further complicated by the large share of undocumented arrivals during the most recent years.
What we see now is that the population adjustments put in at the beginning of 2025 (based on population growth that is no longer true) are pushing the overall labor force number higher. However, by the CPS counts, the foreign-born labor force is shrinking, which causes the model to make up the difference by assigning modeled growth to the native born labor force, despite no evidence this is true. (See a clearer explanation of what’s happening in this blog by Jed Kolko.)
This is critical to understand as the CBO has now accounted for this dramatic downward turn in immigration in their adjustments even while BLS estimates are falsely showing continued growth. When applying the CBO’s new population estimates, labor force growth to 2034, which was 6.4 million in “The Rising Storm,” may actually be closer to 3.5 million—a small number that is a big deal!
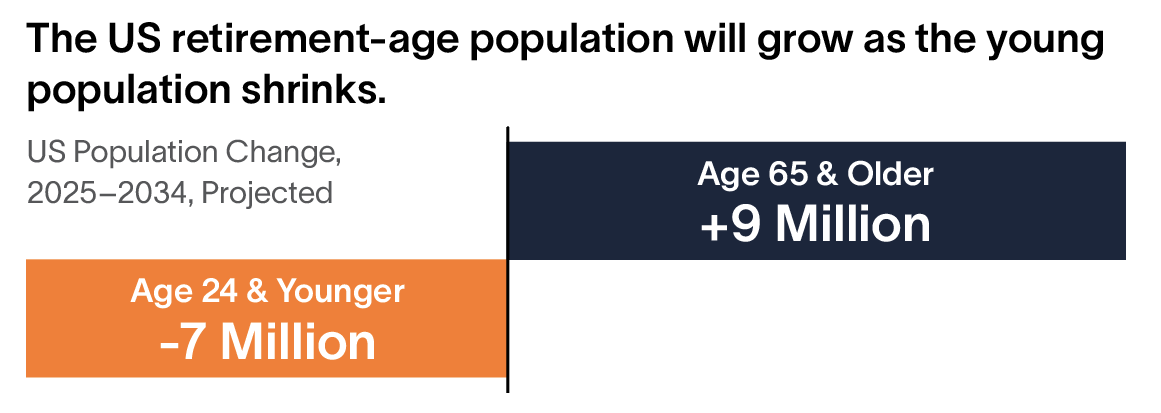
This is actually more troubling than it appears as the downward adjustments to population were almost exclusively in the working-age population of 25-54 year olds. So, while the BLS had expected people over 65 years old to be the primary driver of net employment growth in the next ten years, now they would be projected to carry nearly 3/4 of the net increase, versus less than half when Rising Storm was published!
Driving this dramatic population downward revision is the reversal of the surge years of immigration. Net immigration is projected to be 2.3 million lower in 2025 and 2026 than originally forecasted. In fact, recent estimates expect that the US will now experience net immigration losses in these two years. The new result is that the population increase to 2034 is now projected to be just 8 million. (The original forecast was roughly 18 million!) When we apply labor force participation rates for these age cohorts to this number, we estimate net labor force growth to be around 3.5 million—or less.
Thus, the new ratio of population growth to labor force growth is now closer to 2.5 to one (8 million population growth compared to 3.5 million labor force growth). While this looks much more favorable on the surface than four to one, there will still be less than 2.4 people working for every person not working by 2034. Why? Because, as discussed previously, the downward population adjustment DID NOT AFFECT the over 65 population but rather the working age population driven by incoming immigrant workers no longer expected to arrive.
Labor Market Intelligence on Artificial Intelligence
Artificial Intelligence is a rapidly developing and high-demand technology, but the narrative on AI in “The Rising Storm” has not changed overall. AI is still poorly aligned to help the industries and occupations facing the greatest labor shortages as the storm hits the US over the next several years. For AI to become a major solution to our rising labor demands, it needs to make faster inroads into sectors that are critically understaffed.
Additionally, we’ve been seeing increasing conflation between AI and robotics. Both technologies can perform tasks that previously required humans. But when people refer to technology that performs the manual tasks of humans, they are talking about robotics. In the future, we may see more applications of AI to robotics, but robotics is a distinctly different technology from AI Agents or ChatGPT, and it requires extensive design, manufacturing, testing, and rollout involving engineers and robotic technicians—skilled labor and resources that simply do not exist at the scale needed to alleviate labor needs in the near future, whether in the US or the rest of the world.
The Storm Is Gathering Speed and Intensity
In summary, a year later, “The Rising Storm” is not only still coming, but the intensity may have increased, especially for the non-degreed labor force. As demographic shifts and immigration declines are driving us closer to a shrinking labor force, the market must adapt even sooner than expected. As AI and other US regional changes in recruiting and training priorities lag behind in the sectors with the most imminent demands for labor, the need to prepare for the storm is more urgent than ever.
Are you ready?
To learn more about trends affecting the global labor market like AI, labor shortages, and geopolitics, read our latest research, Fault Lines.